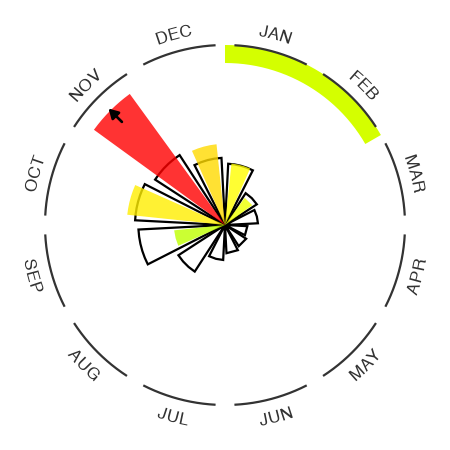
Global Dengue Observatory
  • Home
  • All Countries
  • Regions
    • North & Central America
    • Caribbean
    • South America
    • Europe, Middle East & North Africa
    • Sub-Saharan Africa
    • South Asia
    • East & Southeast Asia
    • Pacific Islands
  • Methods
  • Data
  • About
  • FAQ

Global Dengue Observatory

We bring together dengue data reported by more than 70 countries and use advanced modelling to fill the gaps, providing near real-time insights into how the dengue season is unfolding worldwide.

Current Global Dengue Situation

Scroll to explore

At this time globally we estimate 209,946 cases in February.

This represents 0.5× the expected number of cases for this time of the year. This is an decrease over the number of cases reported in January.

Globally we estimate 468,365 cases have been reported in 2026 as of February.

This represents 0.6× the expected number of cases by this time in the year.

The 2026 dengue season is below average globally so far.

How to read our plots

Each wedge or spoke shows one month of the year. Providing information about the average season in black and the current season in colours. The outside ring shows whether the cumulative cases over the year so far are above or below the average.

How to read plots guide

Deep Dive

Scroll to explore the current situation in each region or jump directly into country-level situation reports. Click on any circular region plot on the map to open the full report for that region.

World dengue plot

Global Dengue Outlook

Data last updated 16 March 2026

Below is the most up-to-date global summary based on our modelling and data integration system.

World map background South America summary plot South America Caribbean summary plot Caribbean Pacific Islands summary plot Pacific Islands South Asia summary plot South Asia North & Central America summary plot North & Central America Sub-Saharan Africa summary plot Sub-Saharan Africa East & Southeast Asia summary plot East & Southeast Asia Europe, Middle East & North Africa summary plot Europe, Middle East & North Africa

High Severity Countries

Below we spotlight the five countries currently running the furthest above their yearly average based on cumulative case ratios. Click on any circular region plot on the map to open the full report for that region..

Explore All Countries →

Cuba

Cuba yearly outlook

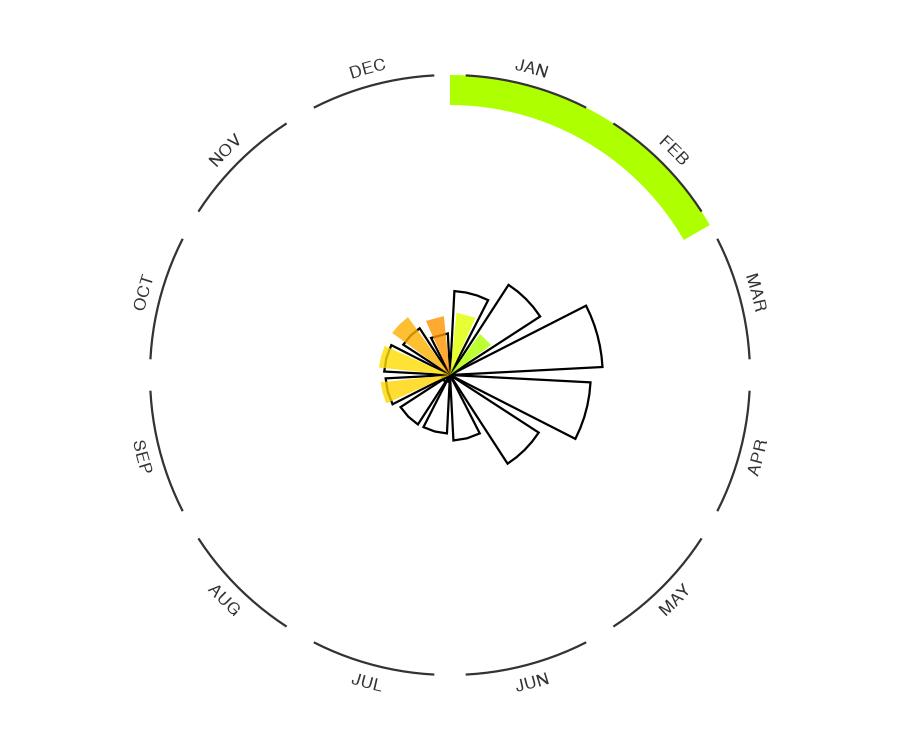
Cuba is estimated to have experienced 5,127 cases this year to date. This is 21.3× the number of cases reported in an average year. This year the dengue situation in Cuba is above average.
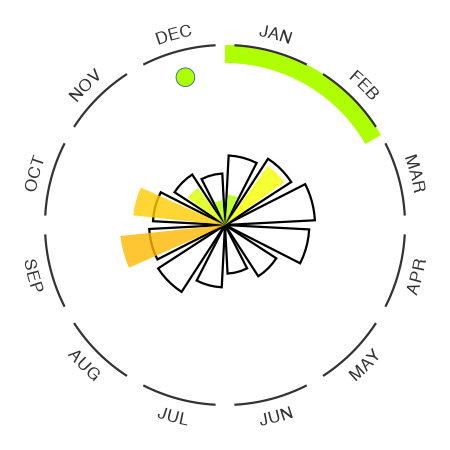
Updated 16 March 2026

Guyana

Guyana yearly outlook

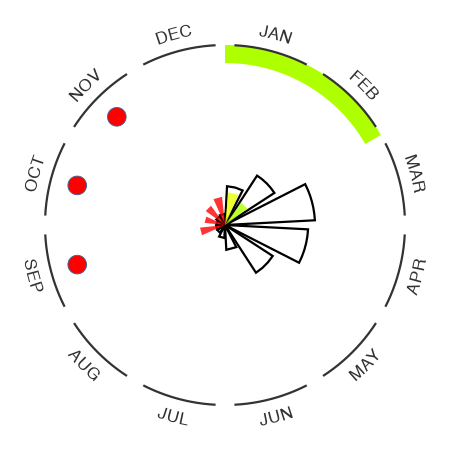
Guyana is estimated to have experienced 22,697 cases this year to date. This is 15.2× the number of cases reported in an average year. This year the dengue situation in Guyana is above average.
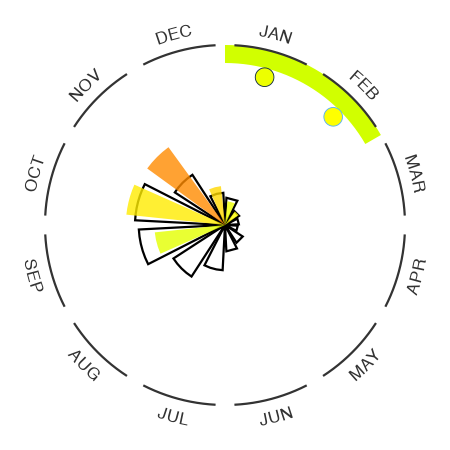
Updated 16 March 2026

Senegal

Senegal yearly outlook

Senegal is estimated to have experienced 2,445 cases this year to date. This is 12.9× the number of cases reported in an average year. This year the dengue situation in Senegal is above average.
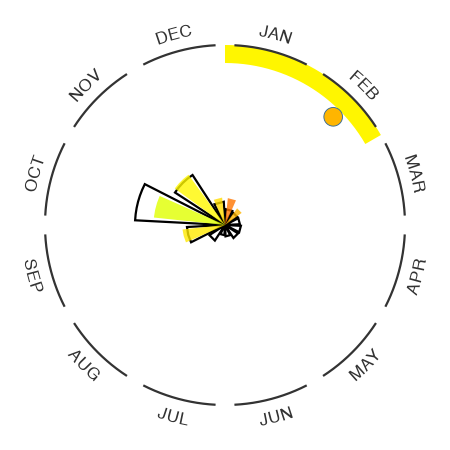
Updated 16 March 2026

Sudan

Sudan yearly outlook

Sudan is estimated to have experienced 2,847 cases this year to date. This is 7.9× the number of cases reported in an average year. This year the dengue situation in Sudan is above average.

Updated 16 March 2026

Timor-Leste

Timor-Leste yearly outlook

Timor-Leste is estimated to have experienced 3,386 cases this year to date. This is 7.2× the number of cases reported in an average year. This year the dengue situation in Timor-Leste is above average.

Updated 16 March 2026
 

© 2025 LSHTM Global Dengue Observatory