Season running low

Pacific Islands logged 1,372 cases in June 2026, running slightly below the seasonal baseline.
Year-to-date totals sit at 9,508, running well below the expected burden.
Data refreshed: 18 July 2026
Pacific Islands logged 1,372 cases in June 2026, running slightly below the seasonal baseline.
Year-to-date totals sit at 9,508, running well below the expected burden.
Data refreshed: 18 July 2026Click any radial plot to open that country's detailed summary page.

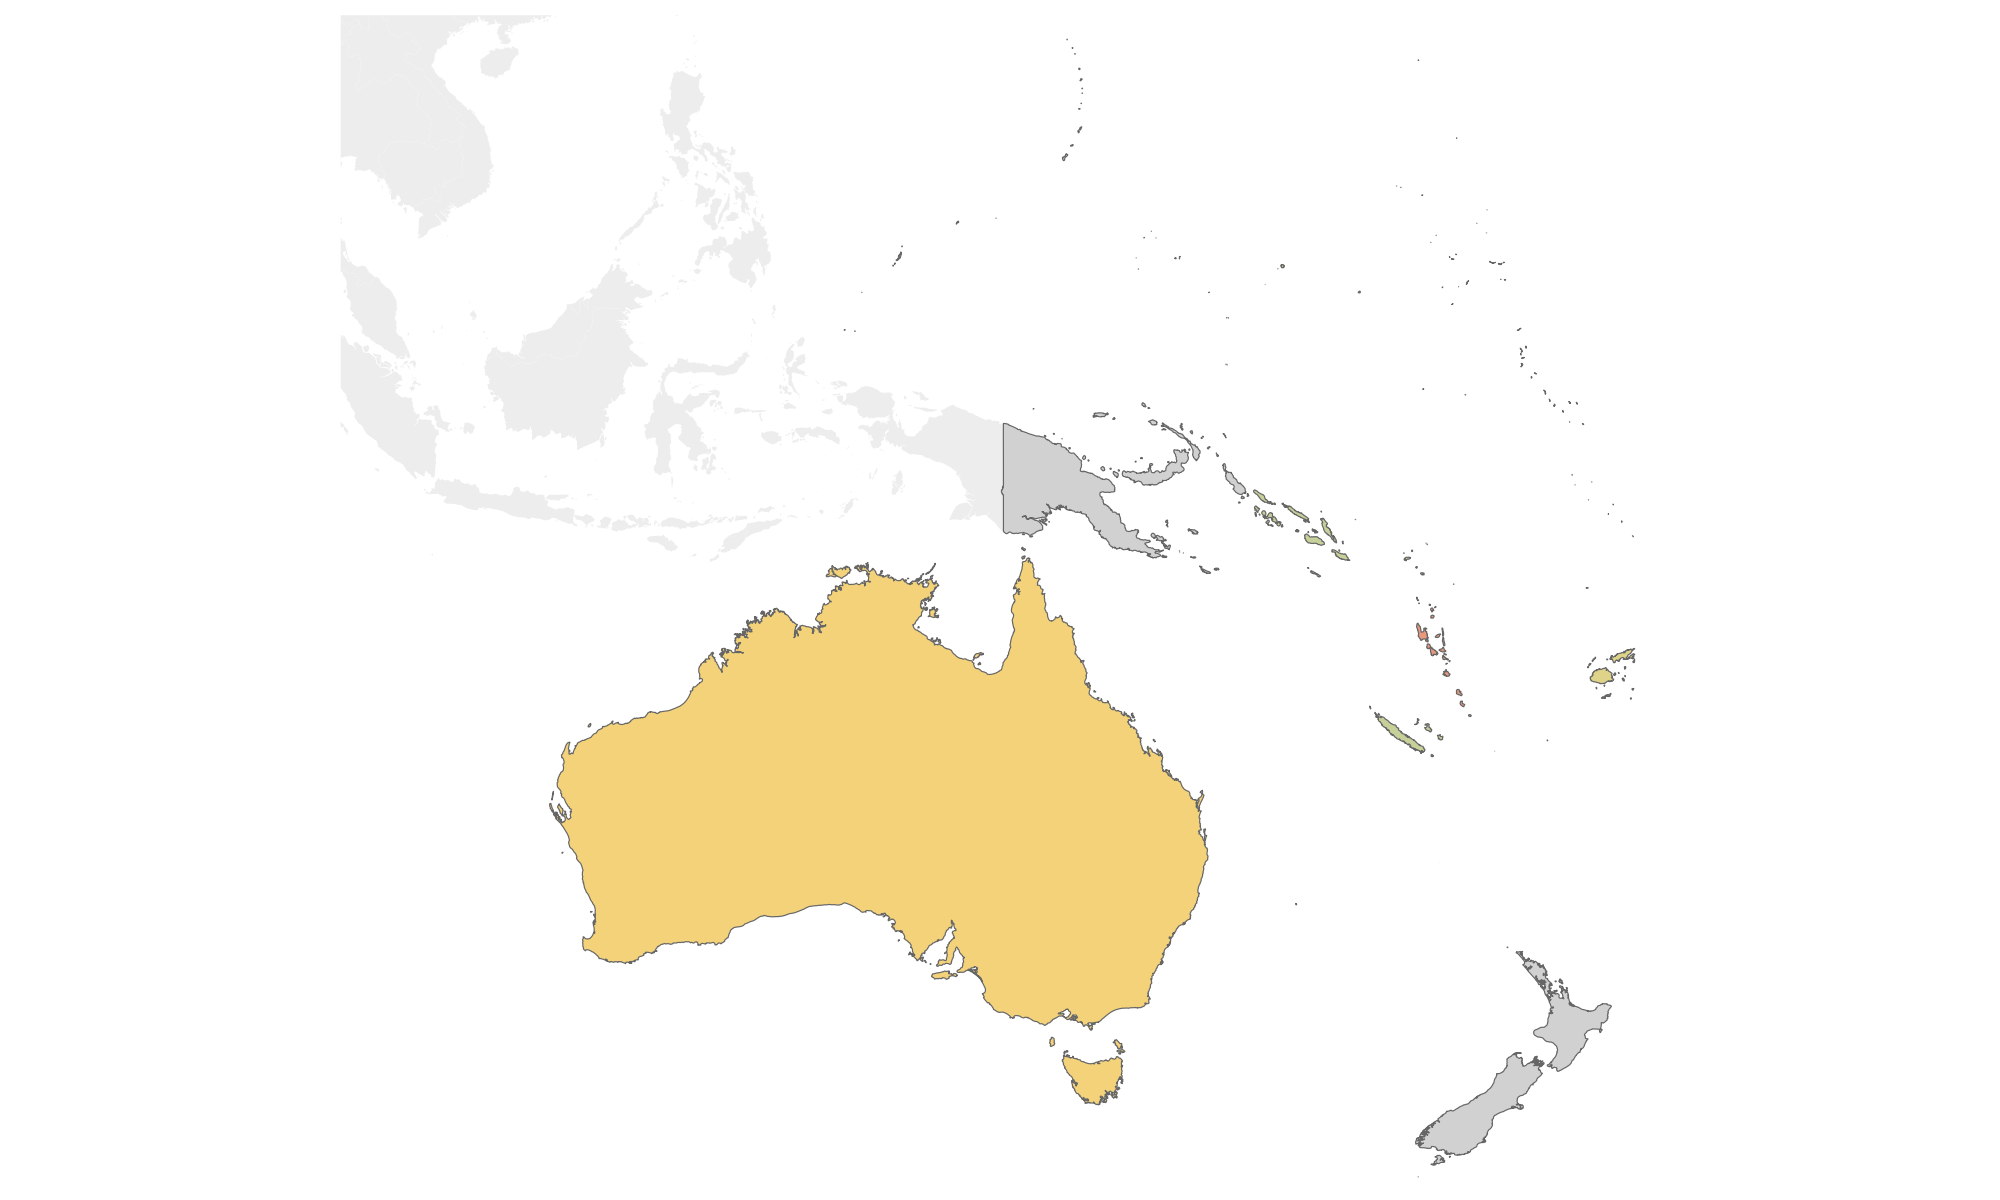
Australia is estimated to have experienced 623 cases this year to date. This is 0.7× the number of cases reported in an average year. This year the dengue situation in Australia is below average.
Some recent months contain estimated data
Cook Islands is estimated to have experienced 1,171 cases this year to date. This is 3.5× the number of cases reported in an average year. This year the dengue situation in Cook Islands is above average.
Some recent months contain estimated data
Fiji is estimated to have experienced 4,049 cases this year to date. This is 0.6× the number of cases reported in an average year. This year the dengue situation in Fiji is below average.
Recent months contain estimated data
Micronesia (Federated States Of) is estimated to have experienced 5 cases this year to date. This is 0.1× the number of cases reported in an average year. This year the dengue situation in Micronesia (Federated States Of) is below average.
Some recent months contain estimated data
Kiribati is estimated to have experienced 309 cases this year to date. This is 1.1× the number of cases reported in an average year. This year the dengue situation in Kiribati is near average.
Some recent months contain estimated data
Marshall Islands is estimated to have experienced 0 cases this year to date. This is 0.0× the number of cases reported in an average year. This year the dengue situation in Marshall Islands is below average.
Some recent months contain estimated data
New Caledonia is estimated to have experienced 1,515 cases this year to date. This is 0.8× the number of cases reported in an average year. This year the dengue situation in New Caledonia is below average.
Some recent months contain estimated data
Palau is estimated to have experienced 7 cases this year to date. This is 0.0× the number of cases reported in an average year. This year the dengue situation in Palau is below average.
Some recent months contain estimated data
French Polynesia is estimated to have experienced 94 cases this year to date. This is 0.2× the number of cases reported in an average year. This year the dengue situation in French Polynesia is below average.
Some recent months contain estimated data
Solomon Islands is estimated to have experienced 110 cases this year to date. This is 0.1× the number of cases reported in an average year. This year the dengue situation in Solomon Islands is below average.
Recent months contain estimated data
Tonga is estimated to have experienced 176 cases this year to date. This is 0.3× the number of cases reported in an average year. This year the dengue situation in Tonga is below average.
Some recent months contain estimated data
Tuvalu is estimated to have experienced 6 cases this year to date. This is 0.2× the number of cases reported in an average year. This year the dengue situation in Tuvalu is below average.
Recent months contain estimated data
Vanuatu is estimated to have experienced 10 cases this year to date. This is 0.2× the number of cases reported in an average year. This year the dengue situation in Vanuatu is below average.
Some recent months contain estimated data
Wallis And Futuna is estimated to have experienced 4 cases this year to date. This is 0.1× the number of cases reported in an average year. This year the dengue situation in Wallis And Futuna is below average.
Some recent months contain estimated data
Samoa is estimated to have experienced 1,429 cases this year to date. This is 0.7× the number of cases reported in an average year. This year the dengue situation in Samoa is below average.
Some recent months contain estimated data