Season running low

South America logged 211,061 cases in May 2026, running well below the seasonal baseline.
Year-to-date totals sit at 1,244,909, running well below the expected burden.
Data refreshed: 18 June 2026
South America logged 211,061 cases in May 2026, running well below the seasonal baseline.
Year-to-date totals sit at 1,244,909, running well below the expected burden.
Data refreshed: 18 June 2026Click any radial plot to open that country's detailed summary page.

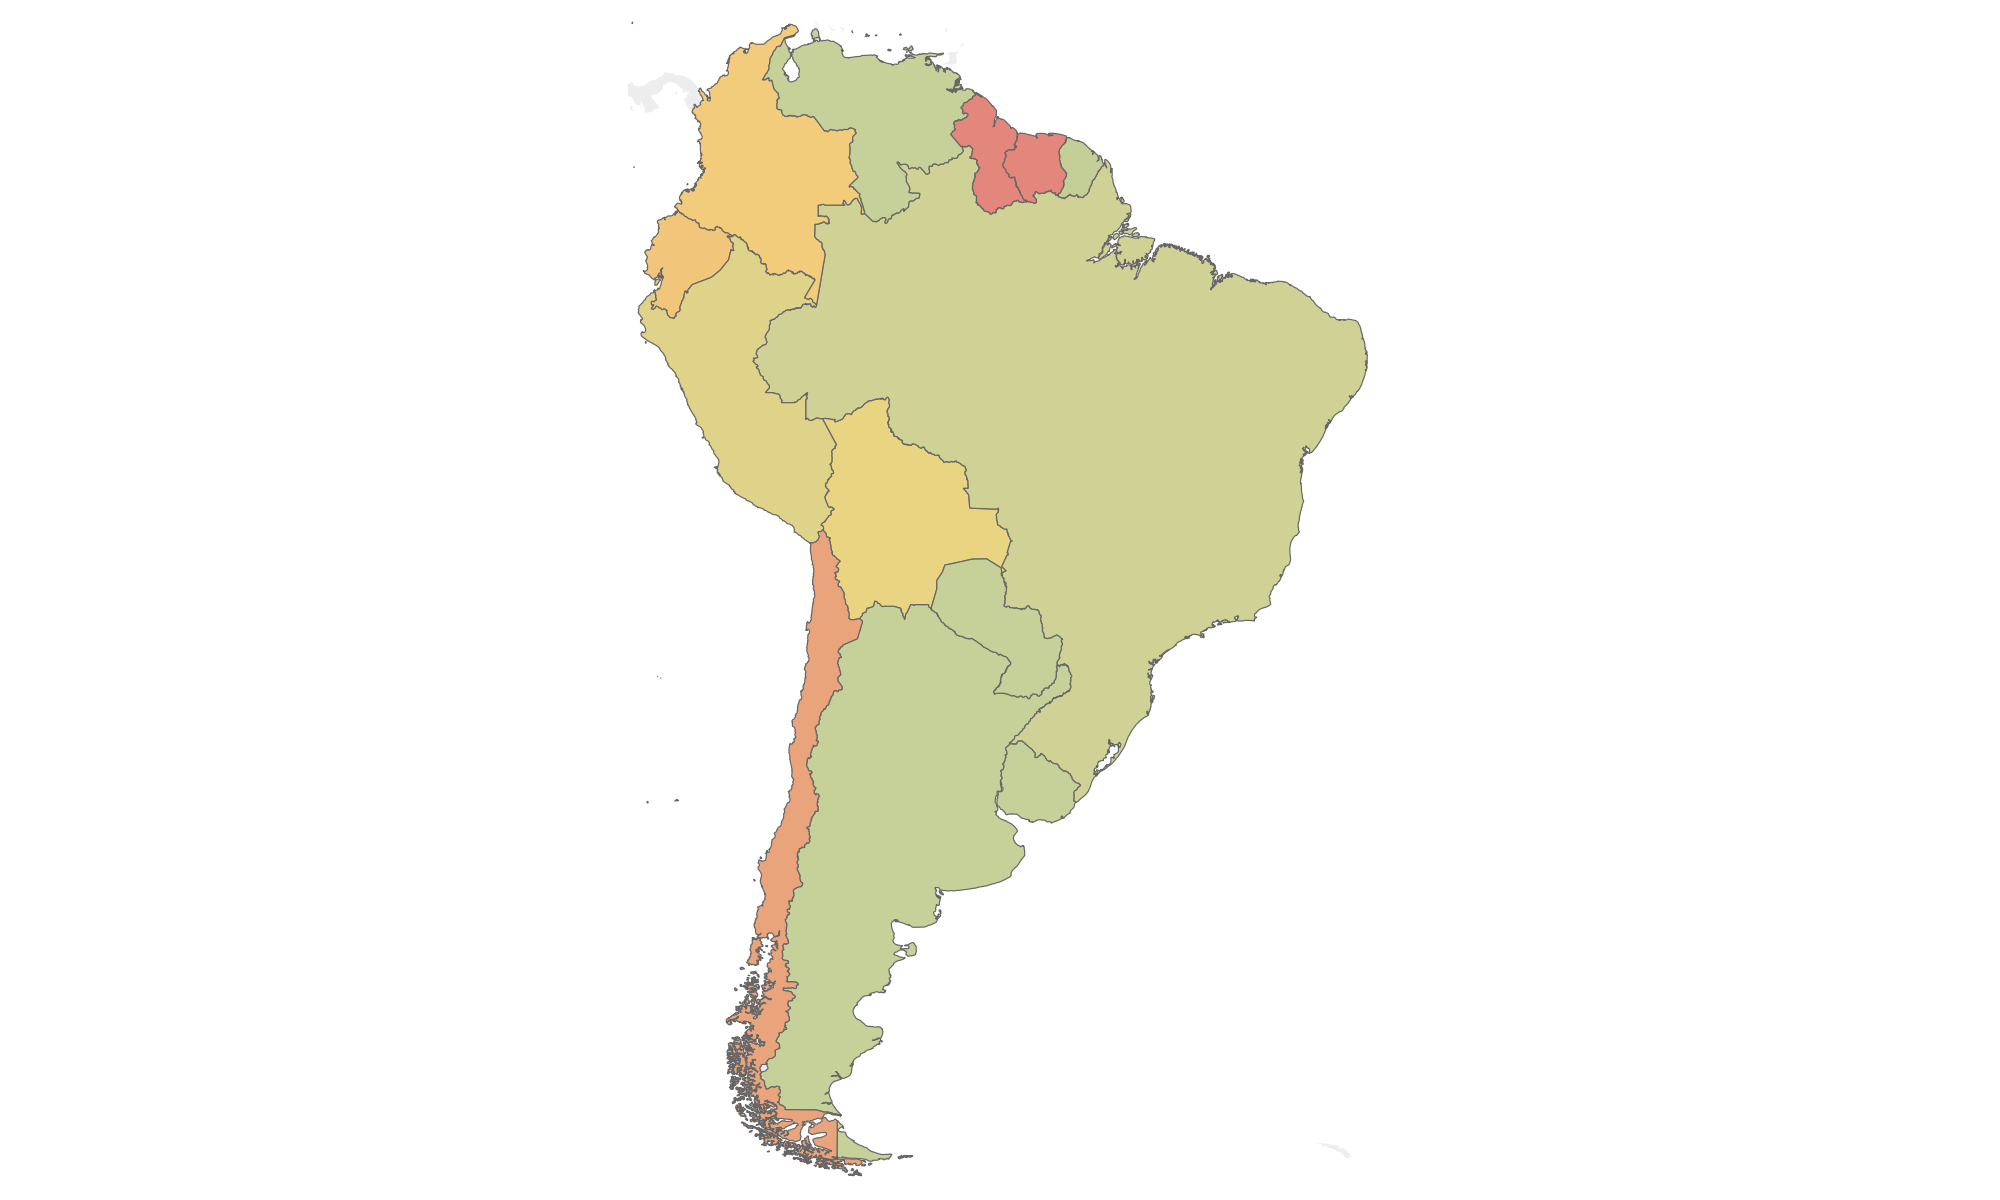
Argentina is estimated to have experienced 69 cases this year to date. This is 0.0× the number of cases reported in an average year. This year the dengue situation in Argentina is below average.
Recent months contain observed data only
Bolivia is estimated to have experienced 50,318 cases this year to date. This is 1.3× the number of cases reported in an average year. This year the dengue situation in Bolivia is above average.
Recent months contain observed data only
Brazil is estimated to have experienced 1,028,984 cases this year to date. This is 0.6× the number of cases reported in an average year. This year the dengue situation in Brazil is below average.
Recent months contain observed data only
Chile is estimated to have experienced 25 cases this year to date. This is 0.8× the number of cases reported in an average year. This year the dengue situation in Chile is below average.
Recent months contain observed data only
Colombia is estimated to have experienced 48,343 cases this year to date. This is 1.0× the number of cases reported in an average year. This year the dengue situation in Colombia is near average.
Recent months contain observed data only
Ecuador is estimated to have experienced 17,009 cases this year to date. This is 1.4× the number of cases reported in an average year. This year the dengue situation in Ecuador is above average.
Recent months contain observed data only
French Guiana is estimated to have experienced 14 cases this year to date. This is 0.0× the number of cases reported in an average year. This year the dengue situation in French Guiana is below average.
Some recent months contain estimated data
Guyana is estimated to have experienced 57,555 cases this year to date. This is 11.7× the number of cases reported in an average year. This year the dengue situation in Guyana is above average.
Recent months contain observed data only
Peru is estimated to have experienced 27,130 cases this year to date. This is 0.6× the number of cases reported in an average year. This year the dengue situation in Peru is below average.
Recent months contain observed data only
Paraguay is estimated to have experienced 8,208 cases this year to date. This is 0.2× the number of cases reported in an average year. This year the dengue situation in Paraguay is below average.
Recent months contain observed data only
Suriname is estimated to have experienced 478 cases this year to date. This is 2.1× the number of cases reported in an average year. This year the dengue situation in Suriname is above average.
Recent months contain observed data only
Uruguay is estimated to have experienced 0 cases this year to date. This is 0.0× the number of cases reported in an average year. This year the dengue situation in Uruguay is below average.
Some recent months contain estimated data
Venezuela is estimated to have experienced 6,776 cases this year to date. This is 0.5× the number of cases reported in an average year. This year the dengue situation in Venezuela is below average.
Recent months contain observed data only